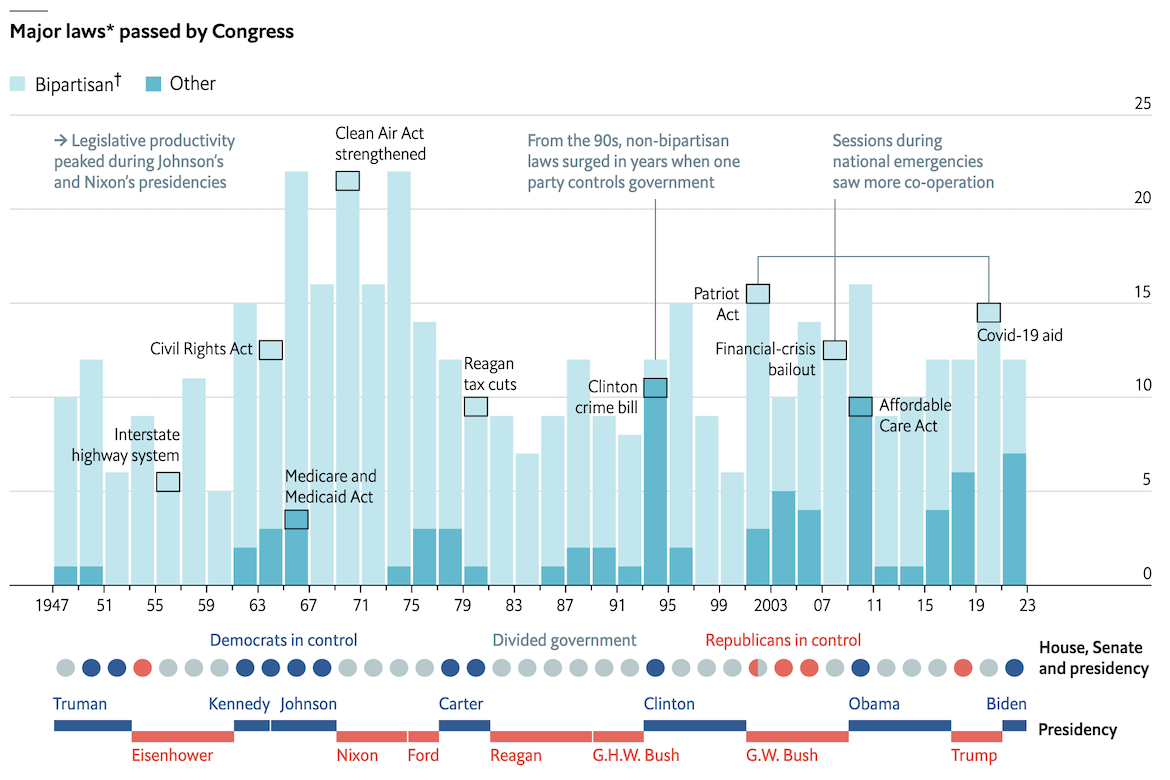
Center for Data Innovation: The Economist has created a visualization tracking productivity in the U.S. Congress. The visualization shows the number of major bills passed in every session of Congress from 1947 to 2023 as well as the party that held control over the House, Senate, and presidency during each session. In the visualization, bills that received support from majorities of both political parties in either the House or Senate appear as light blue while bills that did not receive bipartisan support appear as turquoise. According to the visualization, the 117th Congress passed 12 major bills; however, only five passed with bipartisan support. [Chart sources: David Mayhew; Matt Grossmann; The Economist]
Accurate, Focused Research on Law, Technology and Knowledge Discovery Since 2002

Sorry, comments are closed for this post.